
Quick Answer: LYNX SEO drove 1.03 million organic clicks and 41.7 million impressions for a hemp ecommerce brand over 16 months. Over an overlapping 12 months, the store generated $3 million in purchase revenue with $0 in ad revenue, powered by educational, product-focused content built for Google and AI search.
This ecommerce SEO case study covers a Shopify hemp brand that cannot rely on Google Ads, Meta, or Google Shopping, making organic search a primary growth channel.
LYNX ran the program end to end, including keyword mapping, content production, technical SEO, internal linking, and AEO. Over 16 months, our team built and shipped the pages behind the results.
The data comes from Google Search Console and GA4, showing both search performance and revenue, plus the strategy that made those results possible.
Key Takeaways
- A LYNX-run ecommerce SEO program generated 1.03 million organic clicks from 41.7 million impressions for a hemp brand over 16 months, averaging roughly 64,000 clicks and 2.6 million impressions per month.
- The site’s 2.5% average CTR at an average position of 11.7 is well above published CTR benchmarks for that position, which typically sit under 1% for the first result on page two.
- The top ten pages produced only 9.1% of total clicks, meaning over 90% of organic traffic came from long-tail pages that individually look insignificant in any keyword tool.
- Pages closest to a purchase decision converted impressions to clicks at 5 to 6 times the rate of broad informational pages, even though the broad pages carried far more impressions.
- The store recorded $3 million in GA4 purchase revenue over twelve months with zero ad revenue, in a category where Google Ads prohibits nearly all paid promotion.
Want an ecommerce SEO program that compounds like this? See how LYNX builds organic growth for ecommerce brands.
The Headline Numbers: 1.03M Clicks, 41.7M Impressions, and $3M in Revenue
This is the raw Search Console report, unedited apart from the redacted property name.
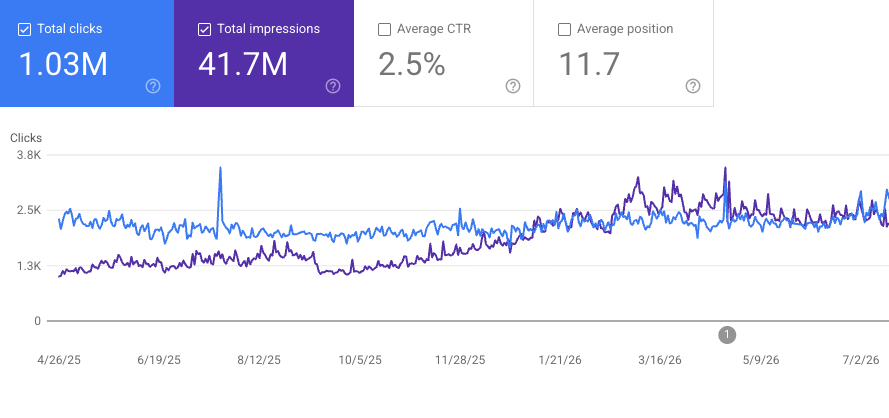
Here is the same top-line performance across both reporting windows, laid out for scanning.
| Metric | Result | Source | What It Actually Tells You |
| Total organic clicks | 1,030,000 | Search Console, 16 months | Roughly 64,000 clicks per month, or about 2,100 per day |
| Total impressions | 41,700,000 | Search Console, 16 months | About 2.6 million impressions per month of category-level visibility |
| Average CTR | 2.5% | Search Console, 16 months | Above benchmark for the average position the site holds |
| Average position | 11.7 | Search Console, 16 months | Top of page two on average, across the entire query set |
| Total revenue | $3,000,000 | GA4, 12 months | All of it purchase revenue, averaging about $250,000 per month |
| Ad revenue | $0.00 | GA4, 12 months | No publisher ad income; every dollar came from product sales |
A store averaging position 11.7 across its entire query footprint still pulled 1.03 million clicks, which is what happens when a site owns thousands of low-competition queries instead of fighting for a handful of high-volume ones.
Reading the Clicks vs Impressions Curve
The Search Console graph shows two lines that behave very differently. Clicks held a fairly steady band between roughly 1,900 and 2,600 per day for most of the period, with two visible spikes above 3,500. Impressions started well below the clicks line on the shared visual scale, then climbed steadily from late November 2025 onward and crossed above it around late January 2026.
That crossover is partly a scale artifact, since the two lines are plotted against different axes. The shape underneath it is real though, and it is exactly what we were building toward: the site’s query footprint expanded dramatically while click volume held its floor and then pushed higher.
That expansion is the leading indicator we manage against. Every new impression is a query the brand was not visible for before, and the queries arrive months before the clicks and revenue attached to them do.
The climb from late November 2025 onward is the content layer reaching critical mass, and it happened during the same period Ahrefs found that AI Overviews correlate with a 34.5% lower click-through rate for top-ranking pages, a figure their follow-up research pushed considerably higher. Holding click volume steady and then growing it while the wider web was losing clicks to AI answers is the part of this chart we’re proudest of.
Impression growth that outpaces click growth is not a warning sign in 2026, it is the expected signature of a content program expanding its query surface while AI answer features absorb a portion of the clicks.
Why a 2.5% CTR at Position 11.7 Is Better Than It Looks
Position 11.7 is the top of page two. Published CTR benchmarks are brutal about that territory. First Page Sage’s ongoing CTR analysis puts position 10 in low single digits, and multiple 2026 datasets put position 11 well under 1%.
This site averaged 2.5%, roughly three to five times what its blended position would predict.
The reason is that “average position” is a blended figure across a very large query set. A site with 41.7 million impressions is ranking for tens of thousands of terms. Plenty of those sit on page three or worse and drag the average down while contributing nothing.
The pages carrying real intent were ranking and converting far better than the headline number suggests, which is what happens when titles, snippets, and answer formatting are written by an editorial team rather than generated from a template.
If you want the full method for reading these numbers properly, we broke it down in our guide to measuring the success of an SEO campaign.
The Ecommerce SEO Strategy Behind the Results
None of this came from technical fixes alone. The program was built around four decisions, executed over months rather than weeks.
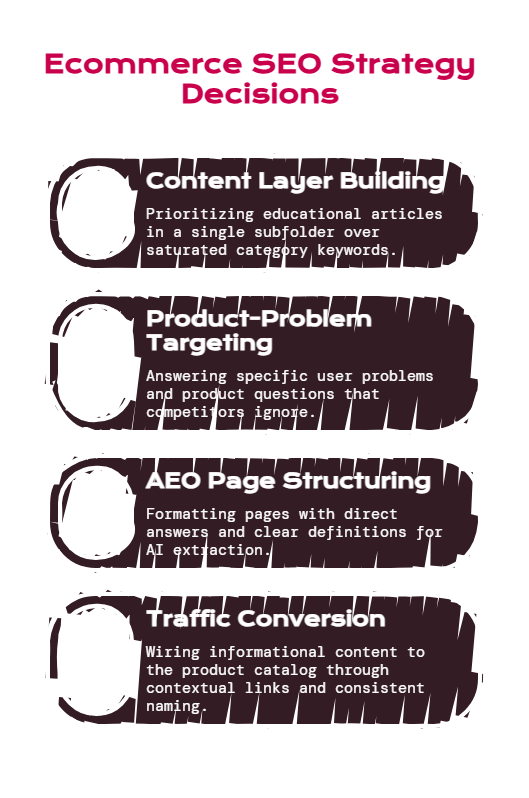
Building a Content Layer Instead of Chasing Category Keywords
Every one of the site’s top ten pages lives in a single /blogs/learn/ subfolder. Not a product page. Not a collection page. Not the homepage. Ten out of ten are educational articles.
That was our call on day one, and it is the decision the entire result rests on. Category terms in hemp and cannabis ecommerce are saturated with marketplaces, directories, and legacy domains that have been accumulating links since 2019.
Trying to win those head terms first is how most brands burn a year and a budget. We pointed the program at the enormous space underneath them instead, which is where nearly all of the actual query volume lives. Ahrefs’ data shows that keywords with fewer than 10 monthly searches account for roughly 93% of their U.S. keyword database, and Backlinko’s analysis of 306 million keywords found 91.8% of all queries are long tail.
Targeting Product-Problem Queries Competitors Ignore
Three of the top ten pages answer a problem someone is having with a product they already own. Another two answer a question about effects. These are queries that almost no brand writes for, because they don’t look like they lead to a sale.
They do. Someone whose cart isn’t hitting is holding a product, is frustrated, and is about to buy a replacement from whoever helped them. We’ve run this pattern across regulated verticals repeatedly and it holds up every time, which is why we led with it here instead of treating it as a filler category. Our cannabis SEO strategy for 2026 covers the query mapping in more detail.
Structuring Every Page for AEO and AI Overviews
We built answer engine optimization into the page template from the first article, rather than bolting it on a year later like most brands are doing now. Each page opens with a direct answer to the query in its title, uses question-formatted subheadings, and defines terms cleanly and early so an AI system can extract them without ambiguity. Google’s own guidance on creating helpful, reliable, people-first content is the baseline here, and it maps almost exactly onto what makes a page citable by an LLM.
Shopify makes parts of this harder than it should be, which we cover in why Shopify stores struggle to show up in AI Overviews.
Turning Informational Traffic Into Product Demand
Traffic that never touches a product page is a vanity metric. We wired the content layer directly into the catalog through:
- Contextual Product Links: Every article links to the specific product that solves the problem it describes, not to a generic collection page.
- Consistent Entity Naming: Product categories, cannabinoid names, and format types use identical terminology sitewide so both Google and LLMs build stable associations.
- Internal Cluster Linking: Articles link to each other along the actual customer question path, so one troubleshooting search can lead to three more pages.
- Answer-First Formatting: The answer appears above the fold, which keeps bounce behavior clean and makes the page easy to cite.
- Commercial Bridges: Educational pages that sit close to a buying decision carry a soft product recommendation rather than a hard sell.
The Top Pages: What 93,773 Clicks From 10 URLs Reveals
Here are the ten highest-click pages from the same Search Console property, with topics generalized to protect the client.
| # | Page Topic | Clicks | Impressions | CTR |
| 1 | Why a tolerance-related effects question happens | 18,046 | 969,336 | 1.86% |
| 2 | How to extract remaining product from a cart | 14,341 | 1,048,442 | 1.37% |
| 3 | Disposable cart troubleshooting guide | 14,007 | 1,479,477 | 0.95% |
| 4 | How to use a live resin vape product line | 7,576 | 259,096 | 2.92% |
| 5 | Best strains for a specific use case | 7,525 | 390,321 | 1.93% |
| 6 | How to use an HHC disposable vape | 7,048 | 288,321 | 2.44% |
| 7 | Best THC drink mix powders | 6,744 | 120,125 | 5.61% |
| 8 | Whether carts stay in your system longer than flower | 6,307 | 1,102,031 | 0.57% |
| 9 | How to fix a vape dropped in water | 6,246 | 822,997 | 0.76% |
| 10 | How to use a delta-8 disposable | 5,933 | 96,138 | 6.17% |
| Top 10 total | 93,773 | 6,576,284 | 1.43% |
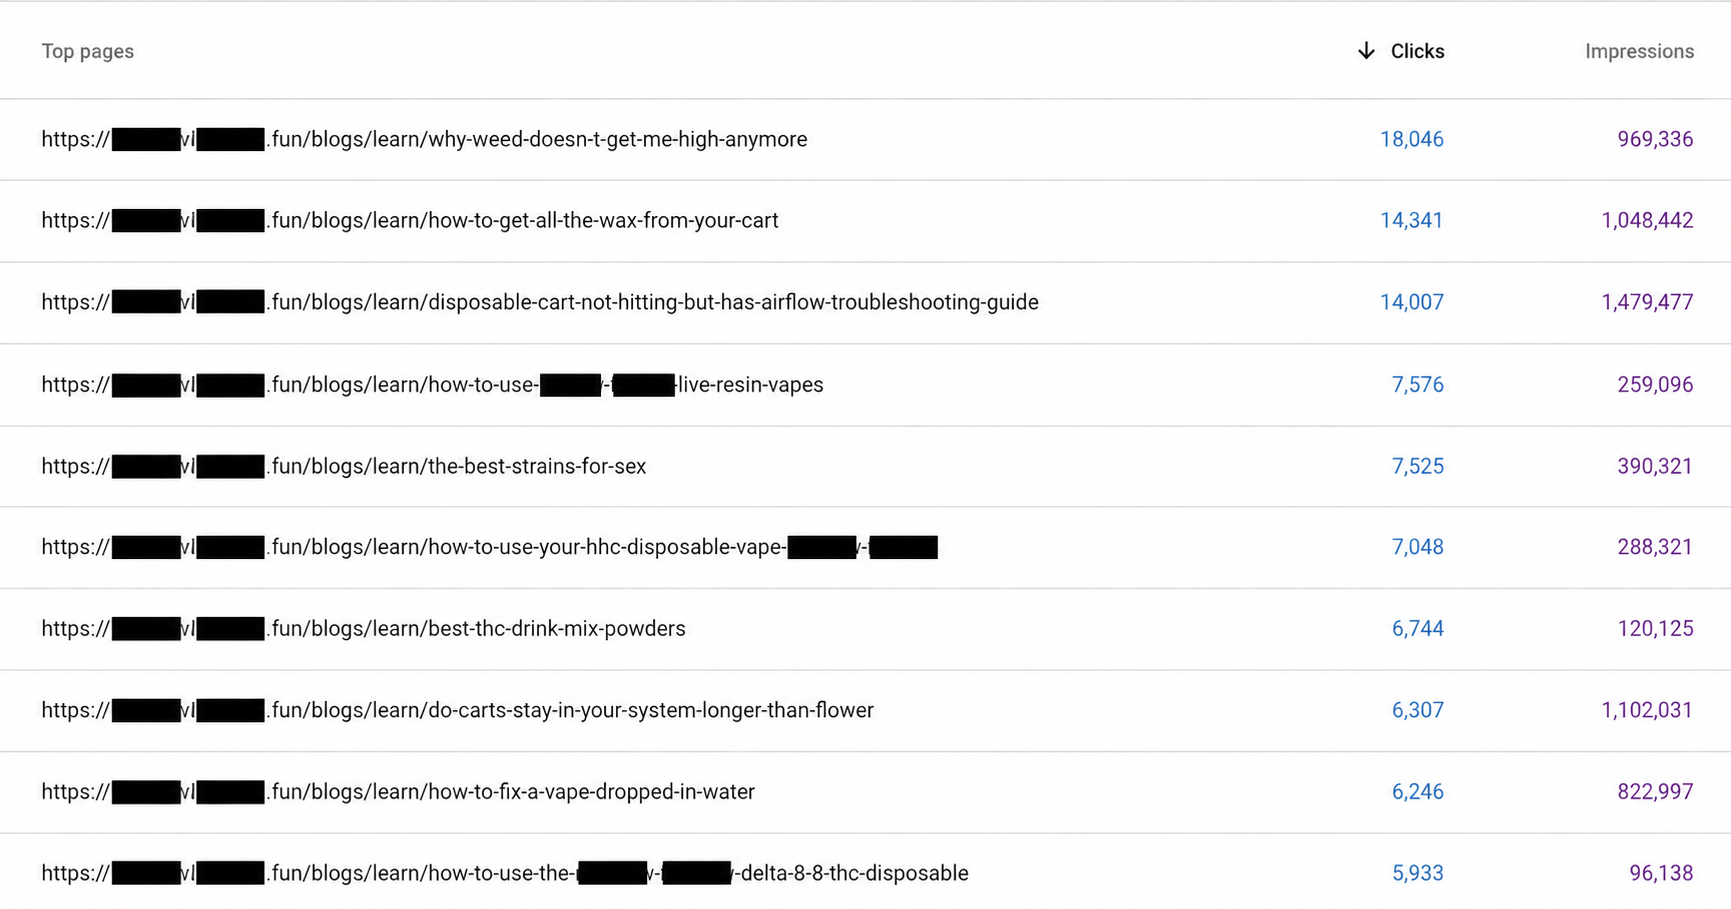
The Long Tail Did the Heavy Lifting
Those ten pages represent 9.1% of total clicks and 15.8% of total impressions. Everything else, the other 936,227 clicks, came from the rest of the site.
Run the math on what’s left and it gets better. The non-top-ten pages converted at a 2.67% CTR versus 1.43% for the top ten. The deep library we built is not filler propping up a few hero articles. It is the most click-efficient part of the entire property.
The pages that make an SEO report look impressive are rarely the pages doing the most work, and any ecommerce SEO case study that only shows you its top ten URLs is showing you less than 10% of the program. Building the other 90% is the part almost no team has the production capacity to sustain, and it is exactly where LYNX earns its place on an account.
This is also why forecasting an ecommerce SEO program off head-term volume produces numbers that never materialize. We wrote about building models that actually hold in how to forecast SEO growth.
CTR Climbs as Pages Get Closer to the Product
Sort that table by CTR instead of clicks and a clean pattern appears:
- Product-Specific Usage Guides: 2.44% to 6.17% CTR. Lower impressions, far higher click rate, closest to a purchase.
- Product Comparison and Best-Of Posts: 1.93% to 5.61% CTR. Commercial intent, moderate impression volume.
- Broad Effects and Pharmacology Questions: 0.57% to 1.86% CTR. Enormous impressions, weakest click rate, heavily affected by AI Overviews and featured snippets.
The three pages with over 800,000 impressions each posted CTRs of 0.95%, 0.76%, and 0.57%. Those queries are exactly the informational type that AI answer features intercept. The three highest-CTR pages are all product-adjacent, and Google has far less reason to answer those in-place.
In hemp and cannabis ecommerce, informational queries buy you impressions and product-adjacent queries buy you clicks, and a serious content program needs both because the first one is what makes the second one rank.
Ecommerce SEO ROI: What 1 Million Organic Clicks Was Worth
The GA4 report shows $3 million in total revenue across twelve months, all of it purchase revenue, with $0.00 in ad revenue. Daily revenue ran a baseline in the $5,000 to $12,000 range with regular spikes above $20,000 and a peak near $30,000 in early April.
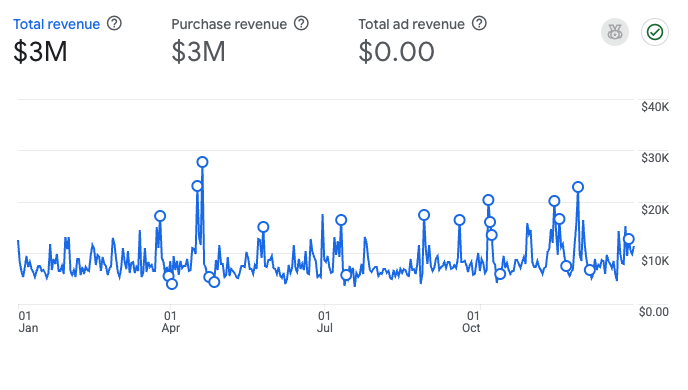
We are not going to tell you every dollar of that is organic-attributed. No honest agency would, and we don’t need to. Here is the range instead, with clicks pro-rated to a 12-month basis for a like-for-like comparison.
| Attribution Assumption | Organic Clicks (12-mo, pro-rated) | Revenue Attributed | Revenue per Organic Click |
| 100% of revenue from organic | 772,500 | $3,000,000 | $3.88 |
| 50% of revenue from organic | 772,500 | $1,500,000 | $1.94 |
| 33% of revenue from organic | 772,500 | $1,000,000 | $1.29 |
Even the most conservative row on that table describes a channel returning well over a dollar per click, in a category where the paid equivalent of that click is not available at any price. Take the middle row and the organic program LYNX built is sitting underneath roughly $1.5 million a year in purchase revenue for a brand that legally cannot run a Google Shopping campaign.
Google’s Dangerous products or services policy blocks the promotion of recreational drugs and psychoactive substances outright, and its unapproved pharmaceuticals and supplements list restricts CBD advertising to LegitScript-certified topical products in a handful of jurisdictions.
Most in-house teams can design a version of this playbook. Where they run out of road is the production volume it takes to hold it for sixteen straight months without the quality slipping, which is the specific problem an ecommerce SEO agency exists to solve.
What This Cannabis and Hemp SEO Case Study Means for Your Brand
The biggest lessons from this campaign are not limited to hemp. They show what a durable ecommerce SEO program looks like when content, intent, and execution are aligned.
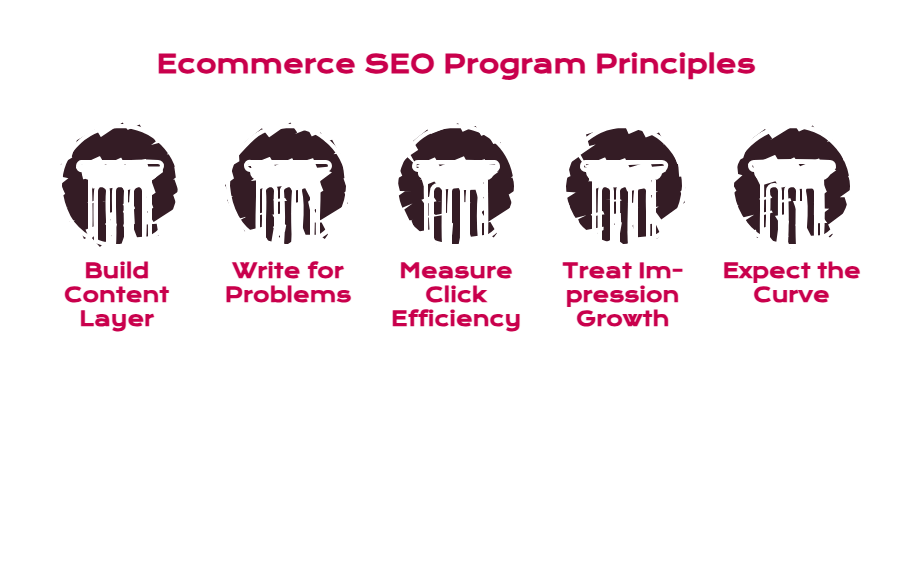
What Transfers to Any Ecommerce SEO Program
- Build the Content Layer Before Fighting for Category Terms: The blog is what makes the collection pages rankable later, not the other way around.
- Write for Problems, Not Just Products: Post-purchase and troubleshooting queries have almost no competition and a buyer on the other end.
- Measure Click Efficiency, Not Just Click Volume: Your highest-impression pages are often your worst performers on a CTR basis.
- Treat Impression Growth as a Leading Indicator: Position moves before clicks do, and clicks move before revenue does.
- Expect the Curve, Not the Spike: This program took sixteen months to reach a million clicks. Nothing about the shape of it was fast.
What Is Specific to Hemp, CBD, and Cannabis Ecommerce
Three things make this vertical genuinely different from ordinary retail SEO.
Paid channels are closed. That removes the safety net most ecommerce brands lean on while SEO matures, and it means the organic program has to carry demand generation from day one. We cover the full picture in our guide to hemp brand SEO and AI search visibility.
AI systems apply extra caution to the category. Cannabis prompts get hedged or refused at a meaningfully higher rate than other verticals, which changes what it takes to get cited. That’s the subject of why hemp and cannabis brands are invisible in AI search.
The regulatory floor keeps shifting. Section 781 of H.R. 5371 rewrote the federal definition of hemp with changes taking effect in November 2026, and legal analysis of the hemp beverage market puts the intoxicating hemp sector at roughly $28.4 billion in value with a large share of it exposed. Content programs in this space need to be built so the informational assets survive a product line changing.
Conclusion: What an Ecommerce SEO Case Study Should Actually Prove
Most ecommerce SEO case studies show a green arrow and a percentage. This one shows the whole account: 1.03 million clicks, 41.7 million impressions, a 2.5% CTR that beats its own position benchmark by a wide margin, and $3 million in purchase revenue in a category with no paid channel to fall back on.
That did not come from ten great articles or a clever tactic. It came from hundreds of pages, mapped to real buyer questions, built to a consistent editorial and AEO standard, and shipped every month for sixteen months by a team that treats content production as an operating system rather than a project. That is the part we’re actually selling, and it is the part the chart at the top of this page is a picture of.
The brands winning hemp and cannabis ecommerce SEO right now are the ones with a team behind them that can hold the line for a year and a half. This is what that looks like on the other side.
Ready to Run This Playbook on Your Store?
We built this one from the ground up, and we can build the same engine on your catalog. This is the work we do for hemp and cannabis brands, and it’s the same system running behind our clients in other restricted and high-competition verticals.
At LYNX SEO you get the whole team, SEO Director, Strategist, Designer, Editor, and Uploader, for a fraction of what that headcount would cost internally, plus the production capacity to hold a content program for sixteen months instead of six.
Frequently Asked Questions
What Is an Ecommerce SEO Case Study and Why Do They Matter?
An ecommerce SEO case study documents the strategy, execution, and measured results of a search program run on an online store. It matters because it’s the only way to evaluate an agency on evidence rather than claims. A useful one shows the raw platform data, including Search Console clicks, impressions, CTR, and average position, plus a revenue figure from analytics. If a case study only shows percentage lifts with no absolute numbers and no screenshots, treat it as marketing rather than proof.
How Long Does Ecommerce SEO Take to Produce Results Like These?
In this case, sixteen months to reach 1.03 million cumulative clicks. Across the ecommerce accounts we manage, meaningful ranking movement on mid-competition terms typically appears within three to six months, with compounding traffic growth arriving somewhere between months eight and fourteen. Anyone promising a million clicks in a quarter is selling something.
Why Do Hemp and Cannabis Brands Need SEO More Than Other Ecommerce Categories?
Because the paid alternatives are closed. Google Ads prohibits promotion of recreational drugs and psychoactive substances, restricts CBD to LegitScript-certified topical products in limited jurisdictions, and Meta applies similar restrictions. A hemp ecommerce brand with no organic program has almost no scalable acquisition channel left. That’s why this cannabis SEO case study shows a $3 million revenue figure with $0 in ad revenue behind it.
Can a Shopify Store Actually Rank Well in Competitive Ecommerce SEO?
Yes. The store in this case study runs on Shopify, and its entire top-ten click set sits in the platform’s native /blogs/ structure. Shopify does create specific obstacles around URL structure, faceted collection pages, and thin product templates, but none of them are disqualifying.
What Is a Good CTR for an Ecommerce SEO Program?
It depends entirely on average position and query mix. This account ran a 2.5% blended CTR at an average position of 11.7, which is strong for that position. A store averaging position 4 should expect considerably higher. The more useful diagnostic is comparing CTR across your own page types, since a page with 800,000 impressions and a 0.5% CTR is usually a title, snippet, or intent-match problem rather than a ranking problem.
How Does AEO Fit Into an Ecommerce SEO Case Study Like This One?
Answer engine optimization determines whether your pages get cited when an AI system answers the query instead of linking to it. In this program it was built into the page template rather than added later: direct answers up top, question-formatted headings, and consistent entity naming throughout.
Do Long-Tail Keywords Really Drive Ecommerce Revenue?
In this account, over 90% of all clicks came from pages outside the top ten. Long-tail pages individually look worthless in a keyword tool, and in aggregate they produced roughly 936,000 clicks. The catch is that long tail only works at volume, which is a production problem before it’s a strategy problem.
How Do You Measure Ecommerce SEO ROI When Attribution Is Messy?
Report a range, not a single number. This case study shows revenue per organic click at three attribution assumptions rather than claiming full credit, because multi-touch journeys in DTC ecommerce almost never resolve cleanly to one channel. Pair GA4 revenue against Search Console clicks over matched windows, state your assumption openly, and track the direction over time rather than obsessing over the absolute figure.
Sources
- Ahrefs. “AI Overviews Reduce Clicks by 34.5%.” 2025. https://ahrefs.com/blog/ai-overviews-reduce-clicks/
- Ahrefs. “Long-tail Keywords: What They Are and How to Get Search Traffic From Them.” 2026. https://ahrefs.com/blog/long-tail-keywords/
- Backlinko. “We Analyzed 306M Keywords. Here’s What We Learned About Google Searches.” 2020. https://backlinko.com/google-keyword-study
- First Page Sage. “Google Click-Through Rates (CTRs) by Ranking Position.” 2026. https://firstpagesage.com/reports/google-click-through-rates-ctrs-by-ranking-position/
- Google. “Dangerous products or services – Advertising Policies Help.” https://support.google.com/adspolicy/answer/6014299?hl=en
- Google. “Unapproved pharmaceuticals and supplements – Advertising Policies Help.” https://support.google.com/adspolicy/answer/2423645?hl=en
- Google Search Central. “Creating Helpful, Reliable, People-First Content.” https://developers.google.com/search/docs/fundamentals/creating-helpful-content
- Clark Hill PLC. “A Billion-Dollar Trade on the Brink: How to Save the Hemp Beverage Industry.” 2026. https://www.clarkhill.com/news-events/news/a-billion-dollar-trade-on-the-brink-how-to-save-the-hemp-beverage-industry/