
SEO forecasting is the process of projecting future organic traffic, leads, and revenue based on current rankings, keyword targets, historical performance, and planned SEO activity. A good forecast tells you what you can realistically expect from organic search – and when. A bad forecast is just a number someone made up to get a budget approved.
Most businesses either skip forecasting entirely or treat it like a one-time exercise before a pitch. Neither approach works. In 2026, with AI Overviews compressing click-through rates and search behavior shifting faster than most models account for, the way you build a forecast matters more than it ever has. This article walks through the three core methods, how to connect them to real business outcomes, and what you need to adjust right now to keep your numbers honest.
Why Forecasting SEO Growth Is Harder Right Now
Before getting into the mechanics, it’s worth naming the thing that’s broken most existing forecasting guides: the relationship between rankings and traffic is no longer as predictable as it was.
AI Overviews are compressing click-through rates at scale. Ahrefs analyzed 300,000 keywords and found that by December 2025, the presence of an AI Overview correlated with a 58% lower average CTR for the top-ranking page. Seer Interactive tracked 25 million impressions across 42 organizations from June 2024 to September 2025 and found organic CTR for queries with AI Overviews dropped from 1.76% to 0.61% – a 61% decline. The position-one CTR numbers that most forecasting templates still use are outdated for any keyword where an AI Overview appears.
This matters for forecasting because the standard model – rank for keyword, multiply by CTR benchmark, get expected traffic – now has a major variable sitting between rank and click that most templates ignore entirely.
There’s a second problem: even queries without AI Overviews are seeing CTR decline. Seer’s data showed non-AIO queries fell 41% year-over-year. Users are answering questions in ChatGPT or Perplexity before they even open Google. Traditional search volume data doesn’t capture that shift. So you can rank well, have a clean SERP, and still see lower traffic than your model predicted – not because you did anything wrong, but because the demand is moving to platforms your keyword tools aren’t measuring.
None of this makes forecasting pointless. It makes honest, scenario-based forecasting more important than ever. What it kills is the false precision of a single-number forecast presented as a guarantee.
The Three Core Methods for Forecasting SEO Traffic
There’s no single right way to forecast organic growth. The most useful forecasts blend all three of these methods, with each one checking the other’s blind spots.
Method 1: Keyword-Based Forecasting
This is the most common starting point. You identify the keywords your business should rank for, estimate monthly search volume, and model how much traffic you’d receive at different ranking positions using CTR benchmarks.
The basic formula is: Estimated Monthly Traffic = Search Volume x CTR at Target Position
So if a keyword gets 2,000 monthly searches and you’re projecting a position-three ranking with a 10% CTR, you’re estimating 200 monthly sessions from that keyword. Aggregate this across your target keyword set and you have a rough traffic ceiling for a given ranking scenario.
The problem with generic CTR benchmarks is they don’t account for what’s actually on the SERP. A #1 result for a commercial keyword in a clean SERP with no featured snippet, no AI Overview, and no local pack is a very different CTR situation than a #1 result for an informational query where Google is answering the question before anyone scrolls. Advanced Web Ranking publishes a free CTR tool with curves segmented by SERP feature combinations, which is more useful than a flat benchmark table.
Better still: use your own site’s data. Pull your actual CTR by ranking position from Google Search Console. Your site has a real click curve that reflects your industry, your brand recognition, and the SERPs you actually appear on. That’s always more accurate than an industry average.
For keywords you don’t currently rank for – new content targets, competitor gaps – apply a 10-20% haircut to any CTR benchmark for queries where you suspect AI Overviews will appear. If you can run those keywords through Ahrefs Site Explorer or Semrush and filter for AI Overview presence, do it. The numbers shift significantly.
Method 2: Historical Trend Modeling
If your site has 12-24 months of organic traffic data, trend modeling gives you a baseline that keyword analysis alone can’t. Instead of asking “what could we achieve,” it answers “what happens if we keep doing what we’re doing.”
Pull 18-24 months of organic sessions from GA4, filtered to organic traffic only – no branded direct, no paid, no referral bleed. Look for the underlying trend line. Is traffic growing month-over-month? Flat? Declining? What’s the growth rate once you account for seasonality?
Year-over-year comparisons are more reliable than month-over-month for most sites because they neutralize seasonal patterns. If you’re in ecommerce, Q4 spikes every year. If you’re in a B2B vertical, summers typically soften. A clean YoY comparison shows whether you’re actually growing or just experiencing normal seasonal variation.
From this baseline, you can project forward by applying your historical growth rate – and then layering on what changes when you add new content, fix technical issues, or build links. Historical trend modeling is the “do nothing” scenario. Everything above that line is the result of deliberate work.
This method breaks down for newer sites with limited data, and it doesn’t tell you why growth is happening or what levers drive it. That’s where the third method comes in.
Method 3: Back-Planning from Business Goals
This one runs the model in reverse. Instead of starting with keywords or traffic trends and projecting forward, you start with a revenue or lead target and work backward to the traffic required to hit it.
The chain looks like this: Revenue target → leads required → traffic required → rankings required → content and links required to achieve those rankings.
If you need 50 new customers per month, and your organic close rate is 3%, you need roughly 1,667 qualified organic visitors per month. If your current traffic is 400 sessions, you have a clear gap to plan against – not a vague ambition to “grow organic traffic.”
This approach forces real conversations about conversion rates, lead quality, and what “organic traffic” actually means for the business. It also exposes where SEO is and isn’t the right lever. If the conversion rate from organic is 0.5% because the site has a broken funnel, no traffic forecast in the world fixes that.
In my experience working with clients across competitive verticals, back-planning is the method that actually gets buy-in from founders and finance teams – because it speaks their language. Traffic numbers are interesting. Lead and revenue projections tied to a credible input model are actionable.
How to Build Your SEO Forecast Step by Step
Step 1: Establish Your Baseline
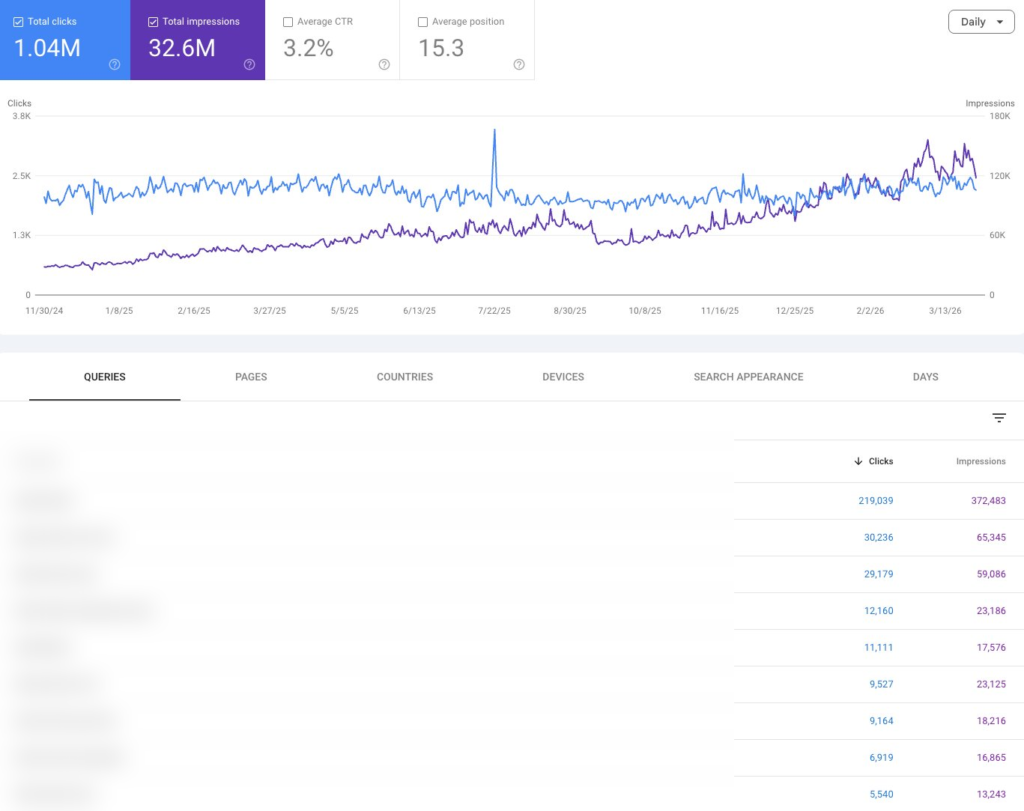
Export 18-24 months of organic traffic from GA4. Pull impressions, clicks, average position, and CTR by query from Google Search Console. Separate branded from non-branded queries – branded traffic has its own dynamics and forecasting it alongside non-branded muddies the model.
Note any anomalies: algorithm updates that hit your site, content migrations, major technical changes, or traffic spikes from viral content. These distort trend lines and need to be flagged rather than baked into projections as if they’ll repeat.
Step 2: Build Your Keyword Target Set
Identify the keywords you’re actively targeting or planning to target in the next 6-12 months. For each keyword, pull:
- Monthly search volume (use Ahrefs or Semrush; cross-reference Google Keyword Planner where possible – volumes vary between tools by 30-50%, so use the median rather than the highest estimate)
- Your current ranking position, if any
- Your target ranking position
- SERP features present – particularly AI Overviews, featured snippets, local packs
- Keyword difficulty relative to your current domain authority
Group keywords by stage: keywords you currently rank on page one for, keywords on page two or three where movement is realistic in the near term, and new keywords where you’d need to build content and authority from scratch. Each group has a different timeline to traffic.
Step 3: Apply Realistic CTR Assumptions
This is where most forecasts get optimistic. Use your own Search Console CTR data for positions you already occupy. For positions you’re targeting, use industry benchmarks as a starting point – but adjust down for any SERP where AI Overviews are likely.
A reasonable working assumption for 2026: any informational query where an AI Overview is triggering should have its projected CTR reduced by 40-60% compared to a clean SERP. If you’re ranking #1 for a query that generates an AI Overview, you’re not capturing 28% of clicks – you’re capturing closer to 12-15% at best, based on the data currently available.
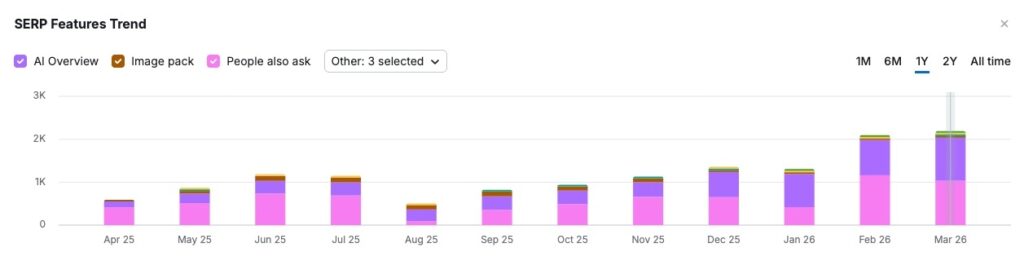
For commercial and transactional queries, AI Overview presence is still less common, but it’s expanding. Ahrefs’ data showed AI Overviews appearing for 172,855 of their tracked keywords by May 2025, up from 10,000 just nine months earlier. That expansion rate should factor into any 12-month projection.
Step 4: Build Three Scenarios
Never present a single traffic number. Always build three scenarios: conservative, expected, and optimistic. Each scenario should have clearly documented assumptions so anyone reading it understands what would need to be true for each outcome.
| Scenario | Assumptions | Traffic Outcome |
|---|---|---|
| Conservative | Slower content production, algorithm headwinds, higher AI Overview interference, 20% below expected ranking movement | Lower bound |
| Expected | Planned content executes on schedule, rankings move at historical average pace, AI Overview impact at current baseline rates | Central estimate |
| Optimistic | Content outperforms, link acquisition accelerates, AI citation gained for priority queries, competitor stumbles | Upper bound |
Present these as ranges, not point estimates. A forecast that says “we expect 8,000-12,000 monthly organic sessions by Q4” is more credible than one that says “we’ll hit exactly 10,000.” The range communicates that you understand the variables involved and have planned for multiple outcomes – that’s what builds trust with leadership.
Step 5: Account for the Lag
SEO traffic doesn’t arrive in a straight line from the date you publish content or build a link. New content typically takes 3-6 months to begin ranking for competitive terms. Technical fixes can show results in weeks, or take months to propagate depending on the issue and crawl frequency. Link acquisition shows results on a delay that depends on domain authority, anchor distribution, and whether the links are being indexed.
Build this lag explicitly into your model. If you plan to publish 15 new articles in January and February, don’t project meaningful traffic from those articles until April at the earliest – and full traffic potential not until Q3 or Q4. Forecasts that front-load traffic growth from a January content push are usually fiction.
Step 6: Connect Traffic to Business Outcomes
Traffic numbers alone rarely get budget approved. The question a CFO or founder is actually asking is: “What does this traffic produce for the business?”
To answer that, you need two additional data points: your organic conversion rate, and the value of a conversion. If you don’t know these from GA4, start tracking them now – every week you go without conversion data is a week you can’t build a credible revenue forecast.
The chain is: Projected Traffic x Conversion Rate = Projected Leads or Sales x Average Value = Projected Revenue
Don’t apply a single conversion rate across your whole traffic forecast. Informational blog traffic converts at a different rate than commercial landing page traffic. If you’re projecting growth across both, segment them and apply segment-specific conversion rates. Applying a 3% conversion rate to a blog audience is almost always wrong.
For service businesses with long sales cycles, you can project leads rather than revenue and apply a close rate and average contract value to get to pipeline. That’s enough to make the business case. Something like: “Our expected scenario projects 85 additional qualified organic leads per quarter at our current close rate, which represents approximately $340K in pipeline.”
That conversation is very different from “we expect 12% traffic growth.”
What to Factor In That Most Forecasts Miss
AI Citation as a Traffic Variable
If your brand is cited within an AI Overview, the traffic picture changes materially. Seer Interactive’s data found that brands cited in AI Overviews earned 35% more organic clicks and 91% more paid clicks compared to brands on the same queries that weren’t cited. Being cited doesn’t just protect you from CTR decline – it actively drives more traffic than a standard organic ranking would.
This means AEO – answer engine optimization – is now a legitimate input into your traffic forecast. If part of your SEO program involves building citation authority with AI systems (structured content, strong E-E-A-T signals, schema markup, brand mentions across authoritative sources), you can project a more optimistic CTR curve for queries where you’re likely to earn that citation. It’s a harder variable to model than keyword rankings, but ignoring it means your conservative scenarios are probably too conservative for brands doing the work right.
Content Production Velocity
The pace at which you produce and index new content has a direct bearing on the shape of your growth curve. A rough working figure in the industry is that 10 well-targeted new pages per month can increase organic growth rate by approximately 8% – but this varies significantly by niche, competition level, and the quality of what’s being published. Thin content at volume doesn’t forecast positively. Authoritative content at a sustainable pace does.
Build your planned content calendar into the forecast explicitly. If you’re publishing 4 pieces per month versus 12, that’s a different traffic trajectory – and the difference compounds over 12 months in ways that aren’t obvious at a glance.
Competitor Velocity
Your rankings don’t exist in a vacuum. If your top three competitors are publishing at double your pace and building links aggressively, your current ranking positions are at risk even if you maintain your own output. Factor competitor content velocity and link acquisition rates into your model, at least directionally. Tools like Ahrefs’ Site Explorer make this reasonably easy to estimate.
Algorithm Volatility Buffer
Google ran multiple core updates in 2025. Build a ±15-20% uncertainty margin into your model explicitly and document it. This isn’t pessimism – it’s responsible modeling. Clients and stakeholders who understand that algorithm updates can move the baseline by 15% in either direction are clients who don’t panic when a core update causes a temporary dip and immediately assume the whole SEO program has failed.
How Often to Reforecast
A forecast built in January and never revisited is a liability, not an asset. The search landscape moves fast enough that a 12-month forecast built on January’s assumptions can be materially wrong by April – not because the strategy failed, but because the inputs changed.
Reforecast quarterly at minimum. Each quarterly review should:
- Compare actuals to forecast across traffic, conversion, and revenue metrics
- Calculate variance: (Actual – Forecast) / Forecast x 100. If you’re consistently running more than 20% above forecast, your assumptions are too conservative. More than 20% below, something in the model is wrong or the strategy needs adjustment.
- Update CTR assumptions based on what’s happening in the SERPs you’re actually appearing in
- Roll the model forward by one quarter with fresh data
- Flag any external changes: new competitors, algorithm updates, significant SERP feature shifts in your target queries
The goal is a living model, not a static document. Quarterly reforecasting is also what keeps the conversation with leadership productive. Instead of defending a number you built six months ago, you’re presenting updated projections with documented reasons for any variance. That’s a very different dynamic.
Forecasting for a New Site vs. an Established One
The approach shifts depending on how much historical data you have.
For established sites with 18+ months of data, historical trend modeling is your anchor. You have real performance patterns to work from. Keyword-based projections layer on top of that baseline to model what planned activity could add.
For newer sites or those in early-stage SEO programs, you don’t have that anchor. Keyword-based forecasting and competitor benchmarking do more of the work. Identify 3-5 competitors ranking for your target keyword set, pull their estimated organic traffic from Ahrefs or Semrush, and use their trajectory as a proxy for what’s achievable. This is inherently less precise, which is why conservative estimates and wider scenario ranges matter more in early-stage forecasts.
For new sites specifically: the realistic timeline to meaningful organic traffic for any competitive keyword is 6-12 months. Anyone promising faster than that without a very specific explanation of why should be questioned. We’ve worked with clients across regulated verticals where the timeline was longer – not because the SEO was slow, but because the competition was serious and shortcuts don’t exist. Building that expectation into the forecast from day one is the most valuable thing you can do.
The Difference Between a Traffic Forecast and an SEO Business Case
A traffic forecast tells you how many sessions to expect. An SEO business case tells you why that’s worth investing in. They’re not the same document, and most SEO forecasts stop at the traffic layer without making the leap.
If you’re presenting to a leadership team, the traffic number is just a step. What they need to see is the revenue chain. What does the traffic produce? At what cost? Compared to what alternative?
The comparison to paid search is worth making explicitly. SEO produces leads at roughly $31 per acquisition versus approximately $181 per lead for paid search, based on current HubSpot benchmarks. The 5-6x cost efficiency advantage is significant – and unlike paid, the traffic doesn’t stop when the budget does. That compounding, durable nature of organic is what makes SEO a better long-term investment for most businesses, but it needs to be stated plainly rather than assumed.
Present three scenarios with documented assumptions. Show the payback period in your expected scenario. Show the cost-per-lead comparison against paid channels. And present the downside clearly – if your conservative scenario still shows positive ROI by month 12, that’s a credible risk profile. If the conservative scenario loses money for 18 months, leadership needs to know that going in.
A forecast that tells the honest story – including the risk – is more likely to get approved and less likely to blow up your credibility when things don’t run perfectly. The ones that promise linear growth with no uncertainty are the ones that create the most damage when reality arrives.
SEO Forecasting Tools Worth Using
You don’t need expensive software to build a solid forecast. Most of what you need is already available through tools you’re probably using.
| Tool | Primary Use in Forecasting |
|---|---|
| Google Search Console | Your actual CTR curve by position, query-level impression and click data, trend analysis for existing content |
| GA4 | Historical organic sessions, conversion rates, revenue attribution from organic, segment-level performance |
| Ahrefs or Semrush | Keyword search volumes, competitor traffic estimates, AI Overview presence by keyword, share of voice modeling |
| Advanced Web Ranking CTR Tool | Free CTR curves segmented by SERP feature combinations – far more useful than generic position benchmarks |
| Google Trends | Seasonality patterns, demand trajectory for keyword categories |
| Google Sheets | Building the actual model – keyword volumes, CTR by position, scenario modeling, revenue projections |
More sophisticated tools like SEOmonitor, BrightEdge, or Conductor add value at enterprise scale – particularly for attributing revenue to organic and modeling large keyword portfolios. But for most businesses, a well-structured Google Sheet built from Search Console and GA4 data beats an expensive platform with a black-box methodology.
Common Forecasting Mistakes to Avoid
Using industry CTR benchmarks without adjusting for SERP features. A flat “position one gets 27% CTR” applied universally is wrong for most queries in 2026. Check what’s actually on the SERP for each keyword you’re targeting.
Front-loading traffic growth from new content. New pages rarely rank competitively in the first 90 days for anything moderately competitive. Build the lag in, or your Q1 numbers will miss and you’ll spend Q2 explaining why.
Ignoring branded vs. non-branded split. Branded queries inflate your apparent organic performance and convert at much higher rates. If you’re growing branded search through offline activity or PR and calling that “SEO growth,” your model is telling a misleading story.
Single-number forecasts. They project false confidence and set you up for credibility problems when variance arrives. Always present a range.
Forecasting traffic without tying it to conversion data. Traffic is a vanity metric if it doesn’t connect to business outcomes. Even rough conversion rate assumptions are better than forecasting traffic in isolation.
Building the forecast once and never revisiting it. A static forecast doesn’t survive contact with a core update, a new competitor, or a SERP feature expansion. Reforecast quarterly.
If you want this kind of thinking applied to your own business – a real forecast built from your data, your keyword landscape, and your revenue targets – LYNX SEO does this as part of how we scope and run SEO programs. At LYNX you get the whole team – SEO Director, Strategist, Content, Technical – working from a model that connects rankings to revenue, not just traffic to vague ambitions. Reach out if you want to see what that looks like for your market.
Sources I Used for This Post
Seer Interactive. “AIO Impact on Google CTR: September 2025 Update.” 2025. https://www.seerinteractive.com/insights/aio-impact-on-google-ctr-september-2025-update
Ahrefs. “AI Overviews Reduce Clicks by 58%: Updated Study.” 2026. https://ahrefs.com/blog/ai-overviews-reduce-clicks-update/
GrowthSRC. “Google Organic CTR 2025: Study of 200K Keywords.” 2025. https://growthsrc.com/google-organic-ctr-study/
AgencyAnalytics. “SEO Forecasting: Predict Organic Traffic Growth in 2025.” 2025. https://agencyanalytics.com/blog/seo-forecasting
SEOProfy. “SEO ROI Statistics for 2026: Data, Benchmarks & Trends.” 2026. https://seoprofy.com/blog/seo-roi-statistics/